Warning
You are reading the documentation for an older Pickit release (3.4). Documentation for the latest release (4.0) can be found here.
Logs
The logs tab displays a record of events that is populated interactively as Pickit runs. It is useful to look back at the history of log records to gain insights on the application, especially when troubleshooting an issue.
Note
The logs tab displays records since Pickit was last started, or a recent subset if the logs grow very large. If you’re interested in inspecting records from a previous period of up to 30 days, you can download the user logs.
Warning
The two checkboxes below the table for Logging data to/from the robot are meant for advanced inspection of the robot socket communication protocol. It is recommended to not enable them unless requested by Pickit support engineers, as they can significantly increase the log message volume.
Table layout
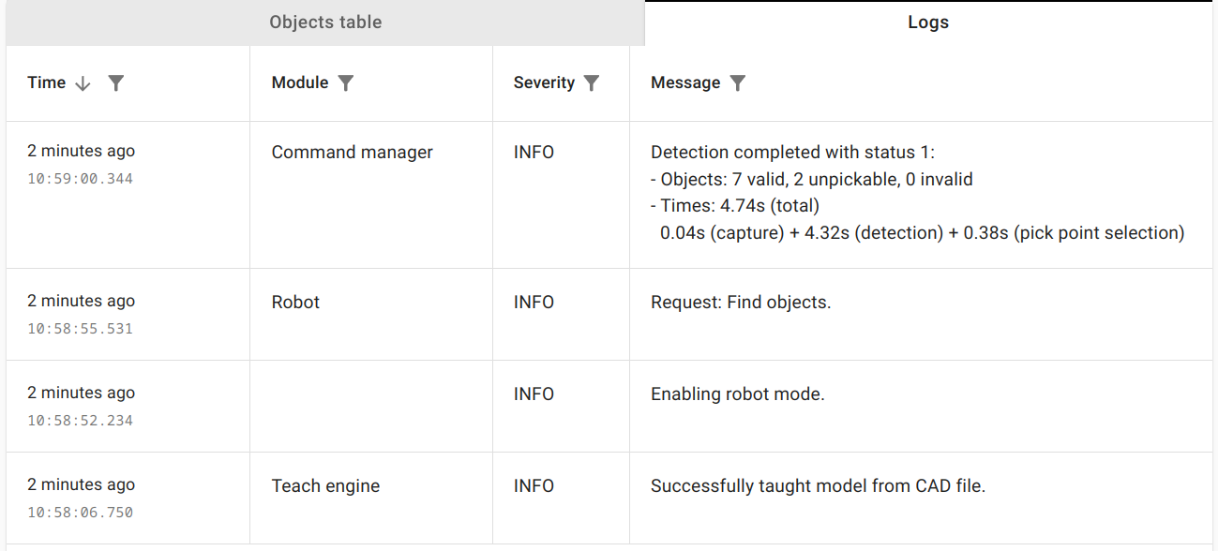
Log records are displayed in a table, where each log record corresponds to one table row. The following information is reported:
The timestamp at which it was generated.
The Pickit module that generated it. A few example modules and their concern is listed below:
Calibrator: Robot-camera calibration.
Camera manager: Pickit cameras.
Command manager: Handle requests from different sources (web interface, robot).
Localizer: High-level object detection pipeline.
Robot: communication between Pickit and robots.
Snapshot manager: Pickit snapshots.
Teach engine: Pickit Teach detection engine.
Message severity:
Info: Useful information.
Warning: Alarming information that may affect behavior, but is expected or acceptable.
Error: Information about a serious and unexpected, but typically recoverable event.
The message itself.
Log filtering
The logs view has a set of powerful filters to customize which log messages are visible. They are accessible by clicking on the funnel icon of each table column:
Timestamp: Include entries belonging to a time interval, like the last hour, or yesterday.
Module: Include entries where the provided string is present in the module name. For example, focus on the robot communication, so only the Robot module.
Severity: Include entries with the selected severities. For example, to visualize concerning information only, include warning and error messages only.
Message: Include entries where the provided string is present in the message. For example, filter for messages involving a specific camera serial.
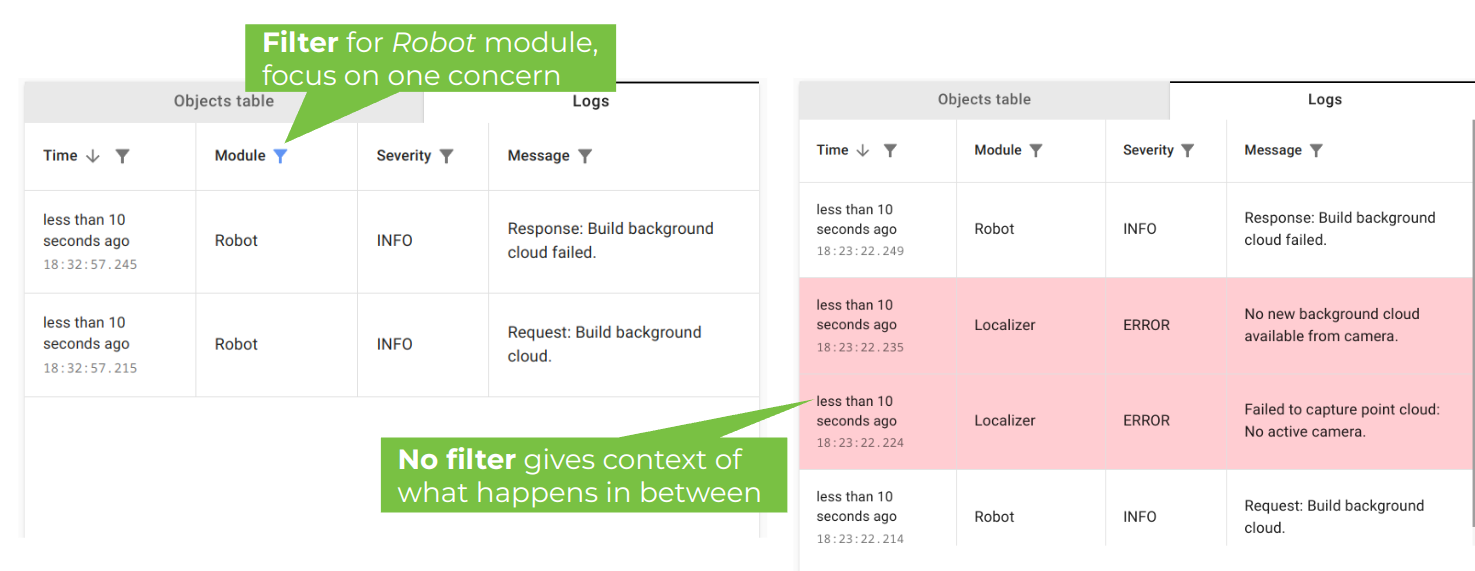
Example
The following is an example that shows the value of the logs and its filtering options.
Below left, we’re filtering to only show messages from the Robot module, so we focus on once concern and ignore the “noise” from all other sources.
We notice that there was an error with a robot’s request to build the background cloud, so we remove the filter to see all messages.
Below right, we can see error messages informing about the failure reason, so we have extra context of what happened between the robot’s request and response. In this case, the operation failed because there was no active camera.